Background
Researching value perception is often still done by using traditional methods such as Van Westendorp and Gabor Granger. The downside of this is that people start thinking about prices rationally. And this isn't how people deal with prices in a real buying situation.
What consumers are willing to pay is determined quickly and intuitively. The brain makes quick calculations upon seeing a product or service and its corresponding price. Therefore, asking what consumers think about a price will not reveal the true willingness to pay. It actually makes consumers think long and hard, which doesn't correspond to how people usually think about prices. An additional problem is that people will be more attached to what something costs instead of its value. This makes them then say they aren't willing to pay more, while this may actually not be the case.
By investigating the consumer's quick and intuitive response, you find out the ideal price for maximum revenue. We will show you how to study this by using three products from three different companies: Haribo Gummi Bears (candy), Hasbro Monopoly (board game) and VanMoof S3 (E-bike).
How was it researched?
To study this, we used NeuroPricing™ Online. NeuroPricing™ Online is a gamified tool where respondents are shown different products and price points. The price goes from extremely low to extremely high and is randomised to avoid anchoring effects. For each price, the respondent has to indicate whether it's cheap or expensive. In addition, we measure response time.
When respondents quickly indicate something as expensive or cheap, the brain doesn't use much effort. When the response time is longer, it means it takes a lot of effort for the brain to make a choice between expensive and cheap. This is the price you are looking for as a company; the ideal price for maximum revenue.
The NeuroPricing™ Online tool originated from many years of conducting pricing research with EEG. With EEG, an 'event-triggered' analysis is made: different product-price combinations are presented to examine which brain areas are activated. The respondents have to react under time pressure, which reduces thinking about the price.
Based on huge data sets of more than 2,500 NueroPricing (TM) EEG brain scans, we built algorithms that now allow us to do pricing research online. This makes it scalable, allowing clients to receive results faster.
The results
The results show three different curves:
- Value Perception Distribution
This curve shows what consumers think the product is worth on average or what they would be willing to pay for it. - Demand curve
The demand curve shows the price elasticity: How many people drop out as the price for the product or service increases? - Revenue - Optimal revenue price curve
This curve literally shows the expected revenue at different price points: expected demand x price.
Additionally: If we know what the variable costs are, we can model a profit curve that reflects the expected contribution margin.
Gummi Bears (Goudberen)
We started the NeuroPricing™ Online study by testing Haribo's classic 'Gummi Bears'.
Value Perception Gummi Bears
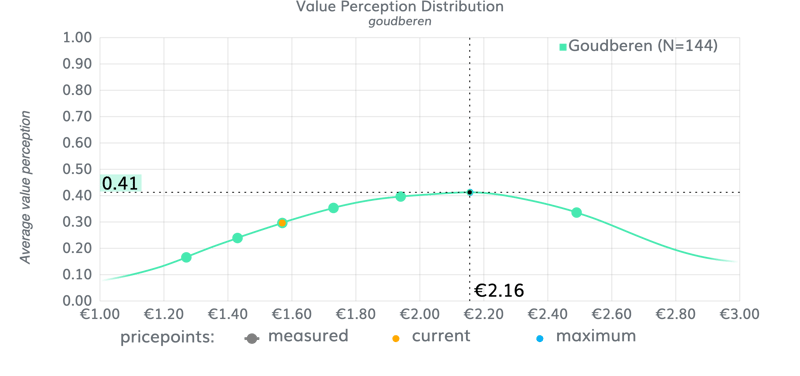
The graph below shows the average value perception of Gummi Bears at that time. It was a lot higher than the then-current price of €1.57 (December 2022) namely €2.16. Here the brain subconsciously reveals that Gummi Bears are worth 59 cents more than what the price was at that time.
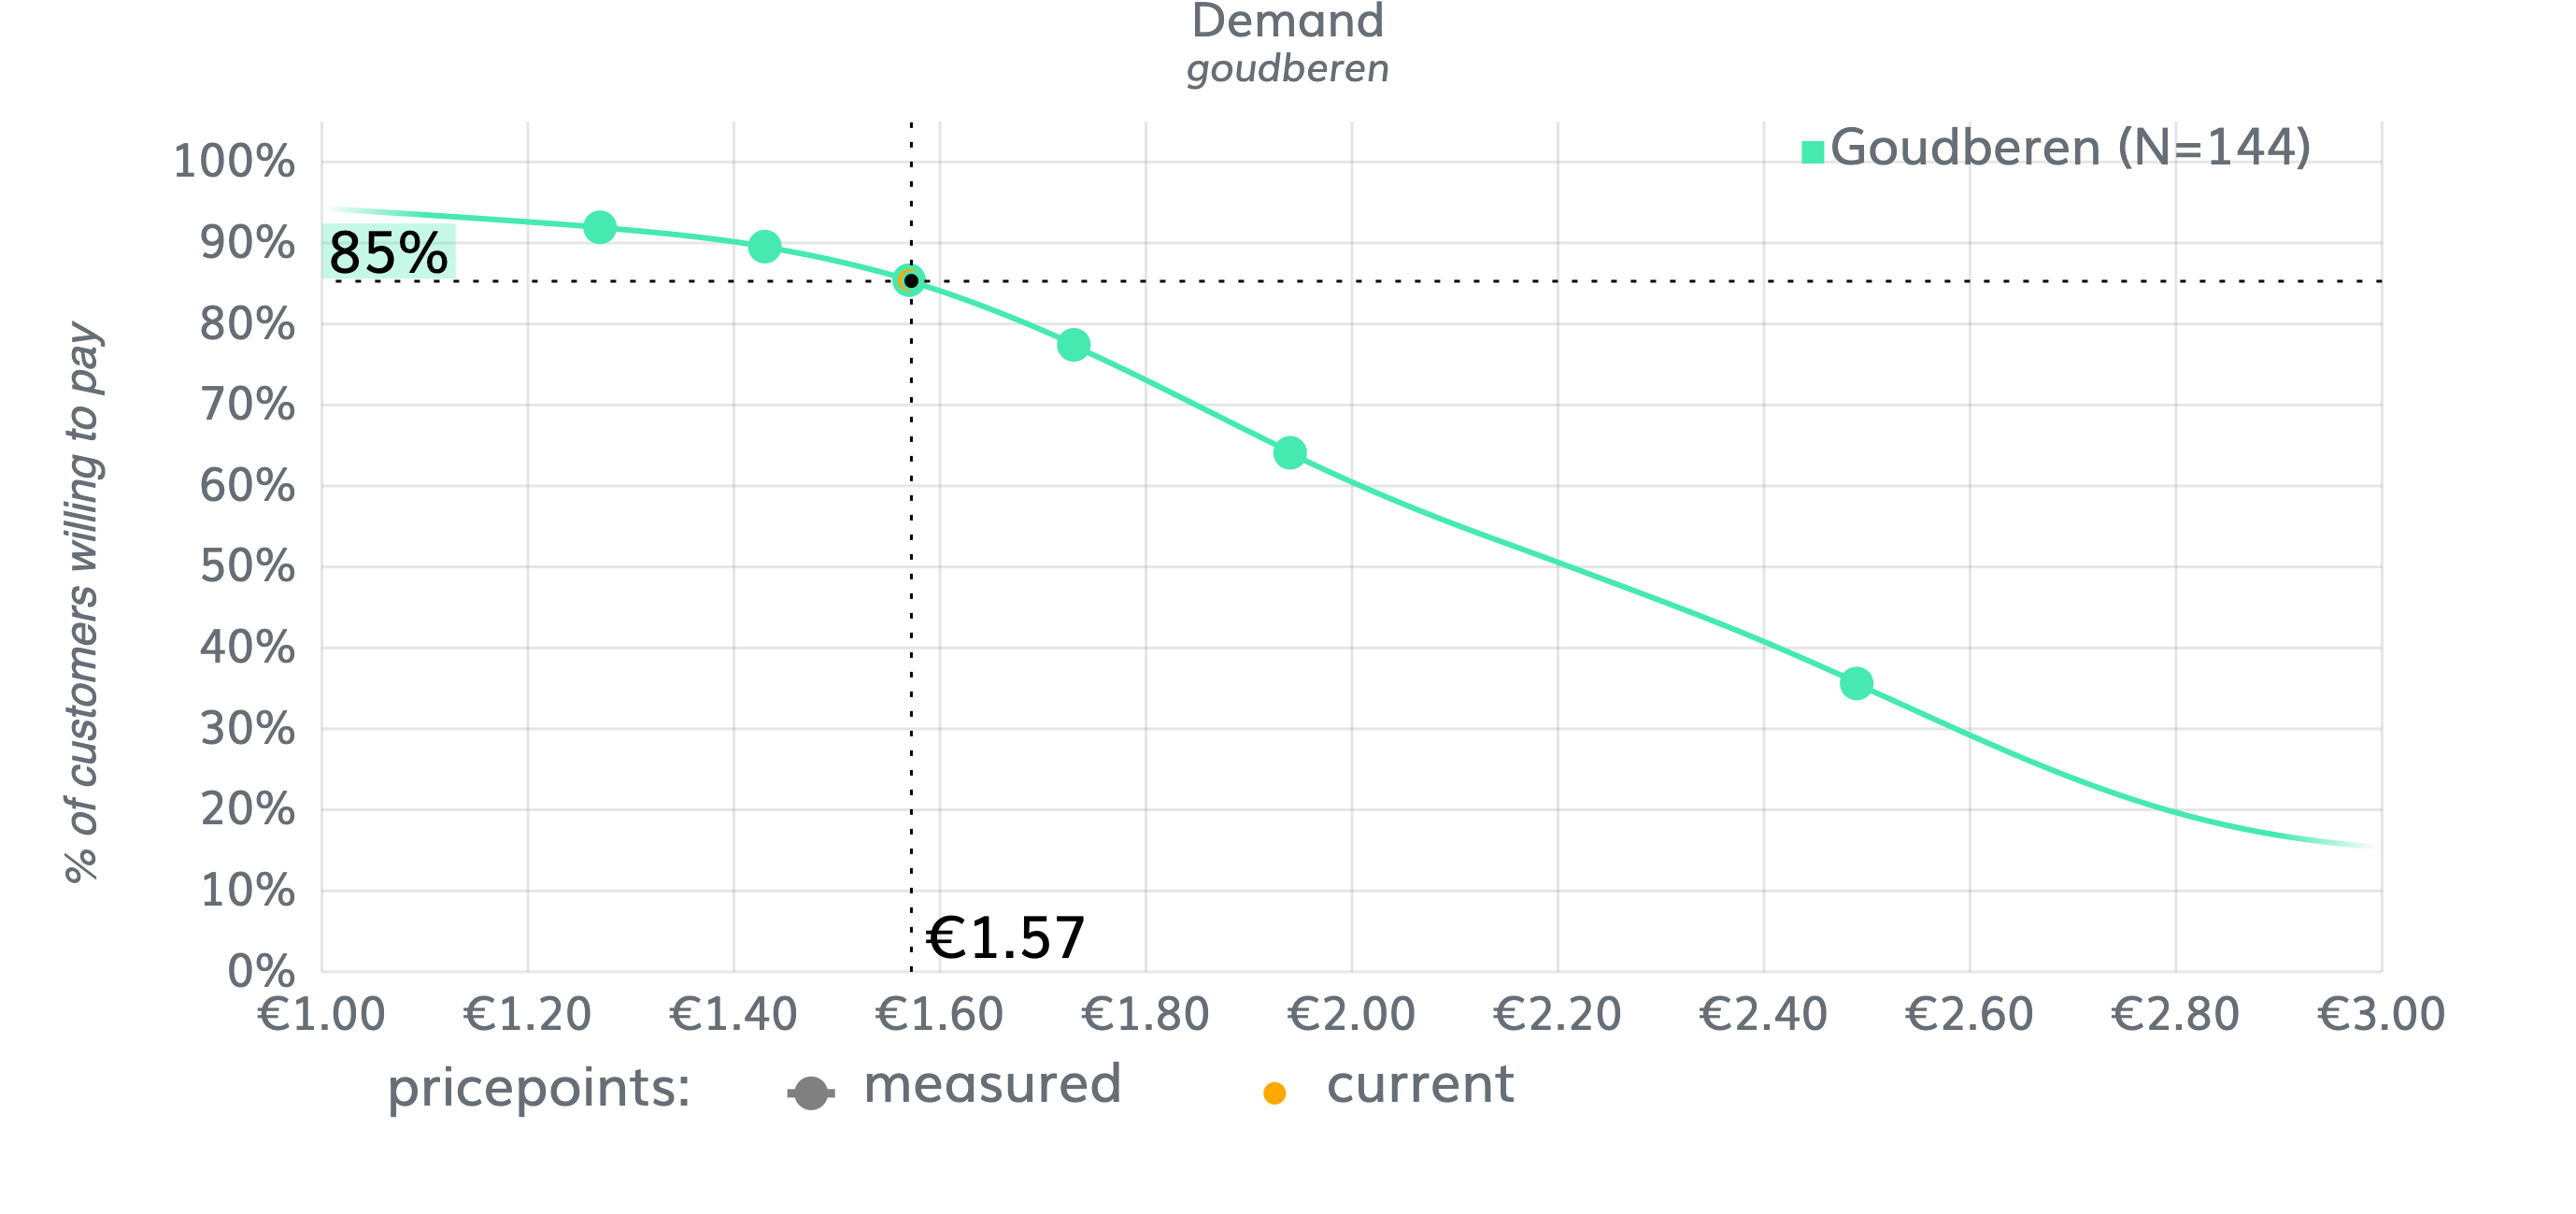
Demand curve Gummi Bears
For the demand curve, we look at the individual value perception curves.
You can see that for 15% of potential buyers, a price of €1.57 was already too high (100% minus 85%). But for the majority of potential buyers it wasn't (85%) (see left graph).
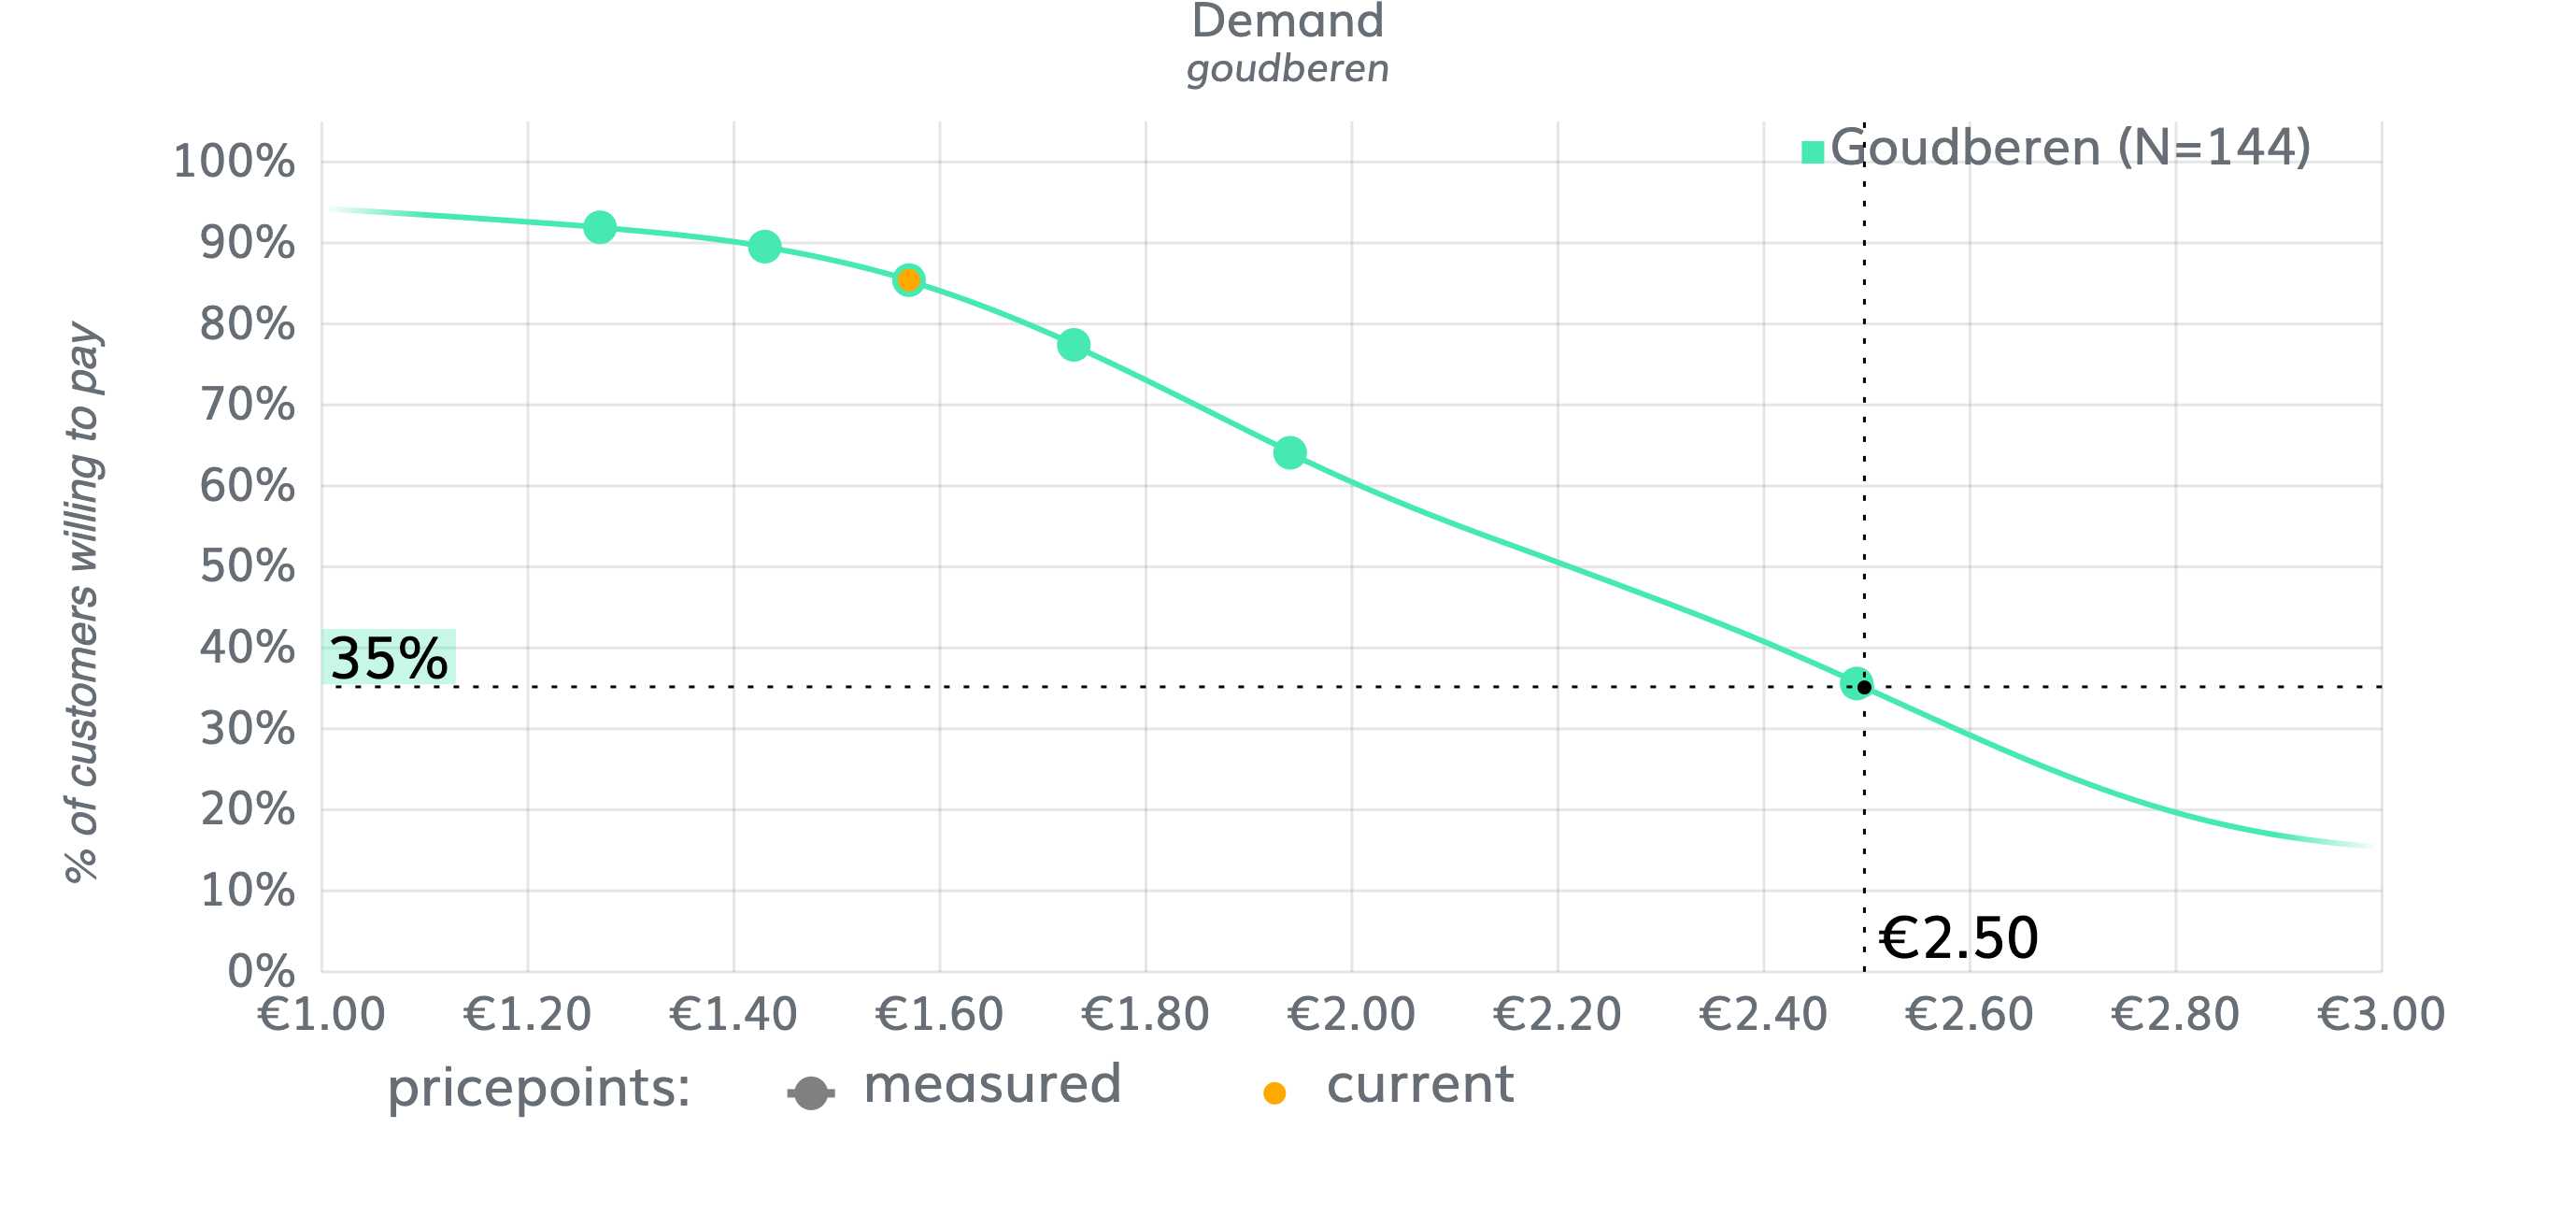
Analogously, suppose the supermarket were to raise the price to 2.50, you can see that the price would have become too high for 65% of potential buyers (see right graph). This way, the demand curve shows the buying scenario at different price points.
Revenue-optimal price Gummi Bears
The graph below shows the optimal revenue price. The optimal revenue price is set at €1.65. There is some stretch here up to €1.74, which can be seen by the plateau in the curve. After this, the curve does really go down. A higher price does mean slightly fewer customers, see the revenue curve below.
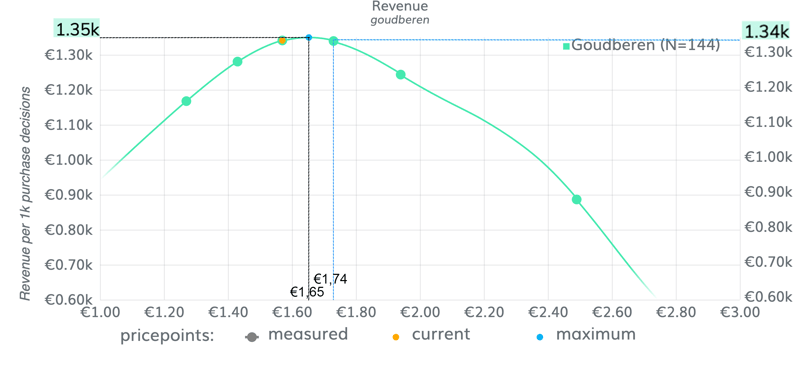
New price Gummi Bears in Dutch supermarket

The price has now been raised to €1.77 by the same supermarket. Using NeuroPricing™ Online, in terms of revenue maximization, we have seen that this price is slightly too high, but the optimal price is always a question of whether your strategy is optimizing contribution margin, revenue or some other parameter of interest.
Monopoly
We also studied the price of Monopoly.
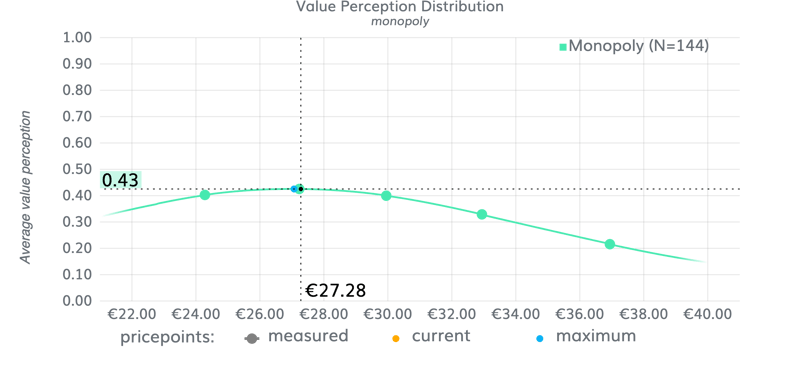
Value Perception Monopoly
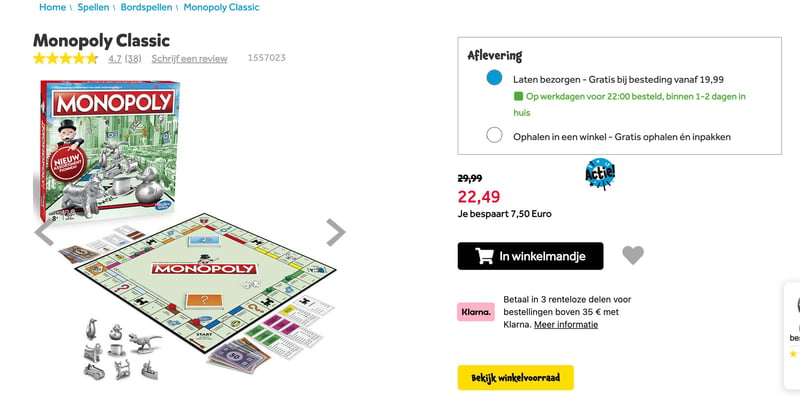
The graph below shows the average value perception of Monopoly. It was slightly lower than the then-current price of €29.99 namely €27.28 (the screen shot above was with a discount, we used the then-current price without a discount: €29.99). So what consumers thought Monopoly was worth on average was €2.71 less.
Compare this with Gummi Bears, where the value perception was higher, you see that for Monopoly the value perception was lower.
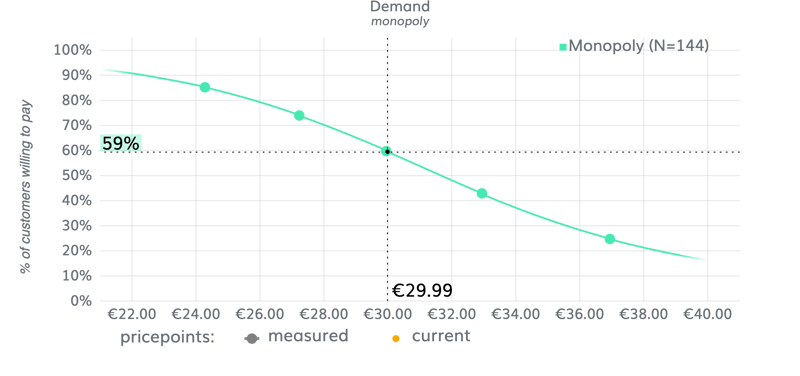
Demand curve Monopoly
Monopoly's demand curve shows that the then-current price of €29.99 was already too high for 41% of potential buyers (100% minus 59%). If a store wanted to attract more potential buyers, the price should be lowered.
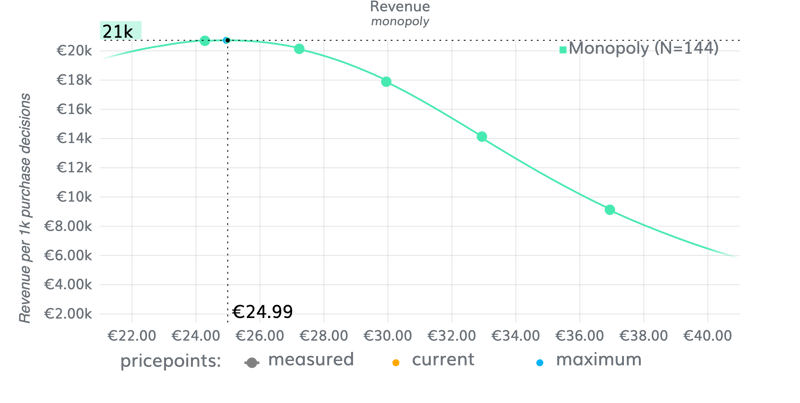
Revenue-optimal price Monopoly
The graph below shows the revenue-optimal price, which is at €24.99. With respect to the revenue maximum, the current price is on the high side.
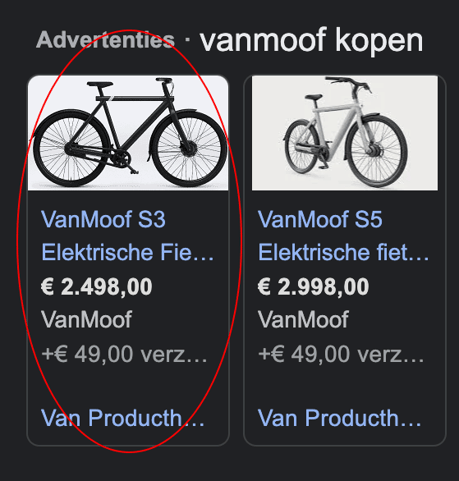
New price Monopoly

Now, the same store has increased the price of Monopoly to €34.99. This study shows that this could be a risky choice, because consumers' average value perception is lower.
However, there is another way to solve this and that is to increase the mental value of the product. This can be done, for example, by adjusting the packaging design or the brand communication. See how to do that in this case study. NeuroPricing™ (Online) always shows you the 'fit' of the value of the product in the consumer's brain and the selling price.
VanMoof
We also studied a model from VanMoof, the S3 (E-Bike). We should mention here that the target group for this study was the 'average Dutch population'. This is not VanMoof's target audience, which potentially affects the results.
Value Perception VanMoof S3
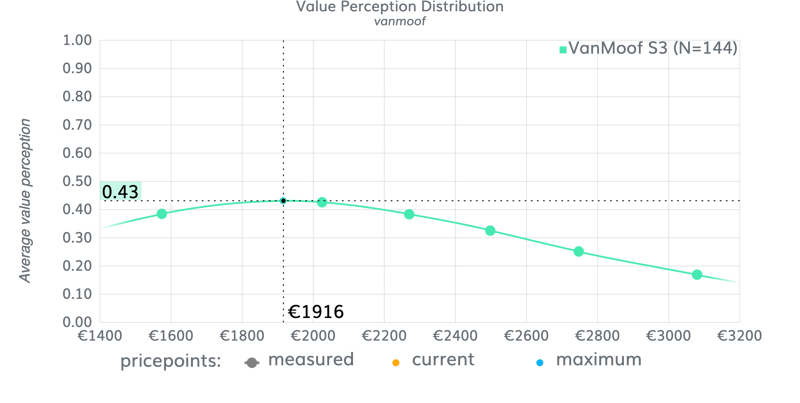
The graph below shows the average value perception of the VanMoof S3. The maximum is a lot lower than the current price of €2,498 namely €1,916. So what the average Dutch population thinks a VanMoof is worth on average was €582 lower.
Demand curve VanMoof S3
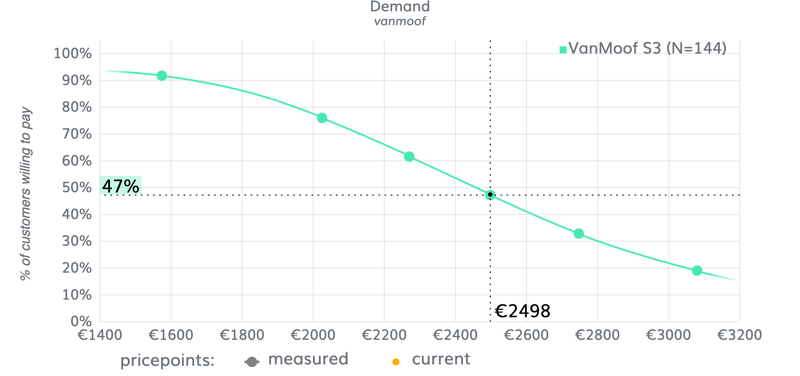
The demand curve of the VanMoof S3 shows that the price of €2,498 was already too high for 53% of the average Dutch potential buyers (100% minus 47%).
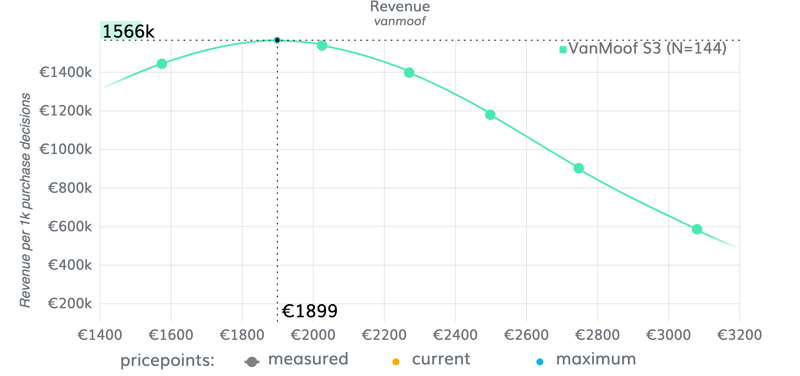
Revenue-optimal price VanMoof S3
The graph below shows the optimal revenue price. The optimal revenue price is at €1899. Looking at the maximum revenue, the current price is on the high side. At a lower price, sales would increase by 33%.
[Update] VanMoof Bankrupt
We did this pricing study in December 2020. Meanwhile, VanMoof has gone bankrupt. The only thing our study shows is that for the average Dutch population, the price of the VanMoof S3 was too high. At a lower price, revenue would increase by 33%. Since demand for VanMoof was already high and so was the cost of repair, more buyers for VanMoof would probably not have been desirable.
Conclusion
NeuroPricing™ (Online) shows what the ideal price is for maximum revenue. The results show that it differs per product whether it is wise to increase your price, lower it or whether the current price was already the ideal one.
In all cases, it's important to know what the mental value of your product is in the consumer's mind. NeuroPricing™ (Online) shows you this and gives you all possible scenarios at different price points. If we receive the variable costs from the customer, we are even able to calculate the maximum profit with NeuroPricing™ (Online). Thus, NeuroPricing™ (Online) gives more insight into the ideal revenue price than traditional studies.
You can only make a fact-based decision to adjust your pricing or start working on the value of your product, when you know the real willingness to pay.

Neem contact op
Vladimir den Baars
Senior Client Executive
Meer weten over de onderzoeksmogelijkheden?

Andries van der Leij
Head of Research & Development
Meer weten over onze onderzoekstechnieken?

Start een project
Heb je vragen over wat Neurensics voor jou kan betekenen? Neem dan snel contact op met Walter.
Vladimir den Baars
Heb je vragen over de onderzoekstechnieken die Neurensics gebruikt? Neem dan snel contact op met Andries.